
















 |
|
 |
|
 |
|
 |
|
 |
|
 |
|
 |
|
 |
|
 |
|
 |
|
 |
|
 |
|
 |
|
 |
|
 |
|
暗号通貨のニュース記事
Bitcoin (BTCUSD) Tumbles From $100,000 High as Interest Rate Outlook Shifts
2025/01/10 12:01
Bitcoin (BTCUSD) price dropped further on Thursday evening, falling below the $94,000 level as investors continued to reassess the outlook for interest rates in 2024.
The cryptocurrency lost ground throughout the day as stronger-than-expected economic data drove up Treasury yields, putting downward pressure on risk-on assets amid concerns that the Federal Reserve may not cut interest rates again.
Notably, spot Bitcoin exchange-traded funds (ETFs) saw their second-largest daily outflow on Wednesday, indicating caution toward the asset class among institutional investors.
Bitcoin had surged more than double over the past year, with the cryptocurrency rising about 33% since November’s election on expectations that the incoming Trump administration and a crypto-friendly Congress will pave the way for a more-favorable regulatory landscape.
Bitcoin was trading at $93,500 late Thursday, down slightly from the day before and well below the high for the week on Monday of near $103,000. The cryptocurrency set an all-time high of around $108,000 in mid-December.
Below, we break down the technicals on bitcoin’s chart and point out important price levels to watch out for.
Bearish Engulfing Pattern Halts New Year Rally
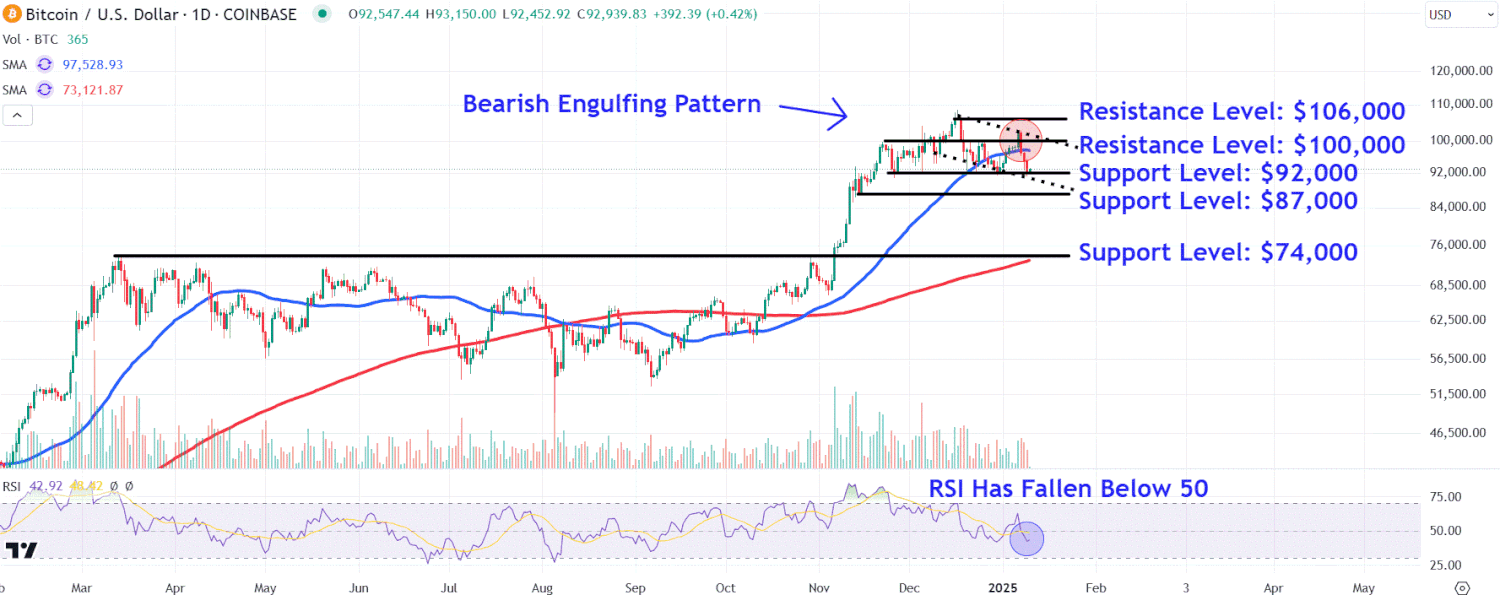
Bitcoin’s price faced significant selling pressure after setting an all-time high (ATH). More recently, the cryptocurrency formed a bearish engulfing pattern to halt last week’s rally back above the closely watched $100K level.
In addition, the relative strength index (RSI) dropped below the 50 threshold and the price fell decisively under the respected 50-day moving average (MA), signaling a weakening in buying momentum.
Let’s turn to bitcoin’s chart to identify key support and resistance levels that investors will likely be following closely.
Key Support Levels to Watch
The first key support level to watch sits around $92,000. This zone may find buying interest near the late-November retracement low and December trough, as well as from the lower trendline of a potential new descending channel forming on the chart.
Selling below the area could see a move down to the $87,000 level, a location on the chart where bitcoin bulls may seek entry points beneath a pennant pattern that preceded the cryptocurrency’s move to its record high.
A decisive close below this level opens the door for a drop to around $74,000. Longer-term investors could look to accumulate the cryptocurrency in this region near the 200-day MA and prominent peaks in March and October. Such a move would represent a correction of around 20% from current prices.
Important Resistance Levels to Monitor
Returning bullish momentum could see another attempt at the psychological $100K mark, though this area on the chart may provide overhead resistance near a range of recent peaks and the descending channel’s upper trendline.
Buying above this level could prompt a retest of the important $106,000 level. Traders who have bought the latest pullback may look to lock in profits around this level.
The comments, opinions, and analyses expressed on Investopedia are for informational purposes only. Read ourwarranty and liability disclaimer for more info.
As of the date this article was written, the author does not own any of the above securities.
免責事項:info@kdj.com
提供される情報は取引に関するアドバイスではありません。 kdj.com は、この記事で提供される情報に基づいて行われた投資に対して一切の責任を負いません。暗号通貨は変動性が高いため、十分な調査を行った上で慎重に投資することを強くお勧めします。
このウェブサイトで使用されているコンテンツが著作権を侵害していると思われる場合は、直ちに当社 (info@kdj.com) までご連絡ください。速やかに削除させていただきます。





