

















 |
|
 |
|
 |
|
 |
|
 |
|
 |
|
 |
|
 |
|
 |
|
 |
|
 |
|
 |
|
 |
|
 |
|
 |
|
ビットコインが53,900ドルに達した9月7日以来、ビットコインは継続的に上昇し続け、最終的に2回の試みで65,000ドルの抵抗線を突破しました。

Bitcoin finally reached $65,000 after a long wait, but it does not look like BTC can sustain at this point. Since September 7 after bitcoin reached $53,900, it has been continuously rising and finally in two attempts breached the resistance at $65k. Let us explore the reasons why we believe bitcoin can retrace back to $64000 or even lower to $63,200.
ビットコインは長い待ち時間を経てついに6万5000ドルに達したが、現時点ではビットコインが維持できるとは思えない。ビットコインが53,900ドルに達した9月7日以来、上昇を続け、最終的に2回の試みで65,000ドルの抵抗を突破した。ビットコインが64,000ドルまで、あるいはさらには63,200ドルまで戻る可能性があると私たちが考える理由を探ってみましょう。
Chart Analysis
チャート分析
At the time of writing, Bitcoin is trading at $65,660 which is above the resistance zone of $65,520. The four hourly chart shows that before finally breaching this section bitcoin had multiple failed attempts. Usually in such a case Bitcoin fails to cross and falls back to reclaim a support zone. This happens because the buyers get exhausted which gives a clean chance to the sellers to drag down the market. However in this case, it looks like more buyers were present during this time and that helped the crypto to rise.
この記事の執筆時点では、ビットコインは65,660ドルで取引されており、これはレジスタンスゾーンの65,520ドルを上回っています。 4 時間足チャートは、最終的にこのセクションを突破するまでに、ビットコインが複数回の試みに失敗したことを示しています。通常、このような場合、ビットコインはクロスに失敗し、サポートゾーンを取り戻すために後退します。これは買い手が疲弊し、売り手に市場を引き下げる絶好のチャンスを与えてしまうために起こります。しかし今回の場合、この間により多くの買い手が存在し、それが仮想通貨の上昇に貢献したようだ。
In this case, the possibility of Bitcoin claiming a support above $65,500 looks thin as RSI is about at the border of overbuying. RSI stands at 70 points and this can cause BTC to come down. Before retracing its steps, there are chances of bitcoin touching $67,000 but might fail to claim a support. On the other hand, if bulls want the market to open in a positive area, they must close the price above the sixty five thousand dollar zone.
この場合、RSIはほぼ買い過ぎの境界にあるため、ビットコインが65,500ドルを超えるサポートを主張する可能性は薄いように見えます。 RSIは70ポイントにあり、これによりBTCが下落する可能性があります。その歩みをたどる前に、ビットコインが67,000ドルに達する可能性はあるが、サポートを主張できない可能性がある。一方、強気派が市場をプラスの領域で開くことを望む場合、65,000ドルのゾーンを超えて価格を閉じる必要があります。
The Negative Chart Pattern
ネガティブなチャートパターン
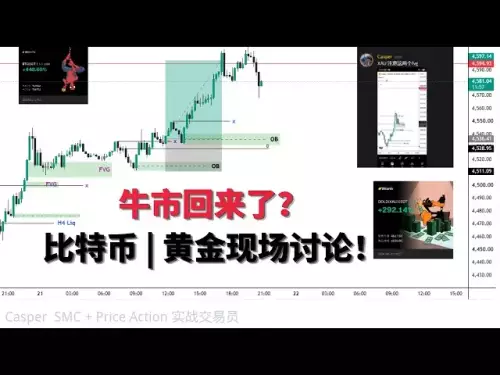
On an hourly chart, if we see the current tip of this chart (marked on picture above), we can see the formation of a shooting star. This is a bearish pattern and is powerful when it appears at the top of a trend. If we take September 7 as the bottom of this trend, the current zone can be considered as the top. The appearance of the shooting star candle pattern along with the negative confirmation candle gives out the vibe of bitcoin rejection from this zone. There is a chance that bitcoin nullifies this pattern if the buying power stays strong.
1時間足チャートで、このチャートの現在の先端(上の写真にマークされている部分)を見ると、流れ星の形成がわかります。これは弱気のパターンであり、トレンドの頂点に現れると強力です。この傾向の底を9月7日とすると、現在のゾーンが頂点と考えられます。流れ星のローソクのパターンと否定的な確認のローソクの出現は、このゾーンからのビットコイン拒否の雰囲気を与えます。購買力が強いままであれば、ビットコインがこのパターンを無効にする可能性があります。
Market Psychology
市場心理学
As today is the last day before the weekend, it is very crucial for the buyers to close the daily candle above $65,000. The bearish month of September is going to close on a Monday and the market should not enter a bullish month with a negative sentiment. Everybody is expecting the bull run to continue and for that Bitcoin must move to create an All Time High.
今日は週末前の最後の日であるため、買い手にとって日足のローソク足を65,000ドルを超えて閉じることが非常に重要です。 9月の弱気月は月曜日に終了する予定であり、市場はネガティブなセンチメントを持って強気月に入るべきではない。誰もが強気相場が続くことを期待しており、そのためにはビットコインが史上最高値を更新する必要がある。
Liquidation Data
清算データ
In the last 24 hours, over 72,000 traders have been liquidated. The most crucial time frame is the last 12 hours. During this period maximum short traders were liquidated as bitcoin kept rising with slight corrections. In the last 4 hours, a total of $26.71 millions worth of traders were liquidated. As the market keeps on rising, traders with shorts open will keep getting liquidation in the absence of stop-loss.
過去24時間で7万2000人以上のトレーダーが清算された。最も重要な時間枠は過去 12 時間です。この期間中、ビットコインはわずかな調整を伴いながらも上昇を続けたため、最大の空売りトレーダーが清算されました。過去 4 時間で、合計 2,671 万ドル相当のトレーダーが清算されました。市場が上昇し続けるにつれて、ショートをオープンしているトレーダーはストップロスがない場合に清算を受け続けることになります。
What to Expect?
何を期待しますか?
Long traders and investors are no doubt expecting the market to keep rising however that is not possible in any scenario. Traders must keep in mind that they are against the market and hence getting over confidence in such critical areas might cost them their funds. In case Bitcon fails to register the support above $65,500 there are chances it comes down to 64,000. This zone can provide support from the trendline as well as from moving average 20. Also the presence of shooting star patterns might give some trouble. If the buying powers keep coming bitcoin only has to justify one support on 4 hourly chart and confirm it. It would be very interesting to see if bulls would be able to hold the price above $63,000 or will it fall back to $64,000.
ロングトレーダーや投資家は間違いなく市場が上昇し続けることを期待していますが、それはいかなるシナリオでも不可能です。トレーダーは、自分たちは市場に反対しているため、そのような重要な分野で過信すると資金を失う可能性があることを心に留めておく必要があります。ビットコンが65,500ドルを超えるサポートを登録できなかった場合、64,000ドルにまで下がる可能性があります。このゾーンは、トレンドラインおよび移動平均線 20 からのサポートを提供できます。また、流れ星パターンの存在により、何らかの問題が発生する可能性があります。買い勢力が継続的に来れば、ビットコインは4時間足チャートで1つのサポートを正当化し、それを確認するだけで済みます。強気派が価格を63,000ドル以上に維持できるのか、それとも64,000ドルに戻るのかを見るのは非常に興味深いだろう。
免責事項:info@kdj.com
提供される情報は取引に関するアドバイスではありません。 kdj.com は、この記事で提供される情報に基づいて行われた投資に対して一切の責任を負いません。暗号通貨は変動性が高いため、十分な調査を行った上で慎重に投資することを強くお勧めします。
このウェブサイトで使用されているコンテンツが著作権を侵害していると思われる場合は、直ちに当社 (info@kdj.com) までご連絡ください。速やかに削除させていただきます。





