|
|

|
|

|
|

|
|

|
|

|
|

|
|

|
|

|
|

|
|

|
|

|
|

|
|

|
|

|
|
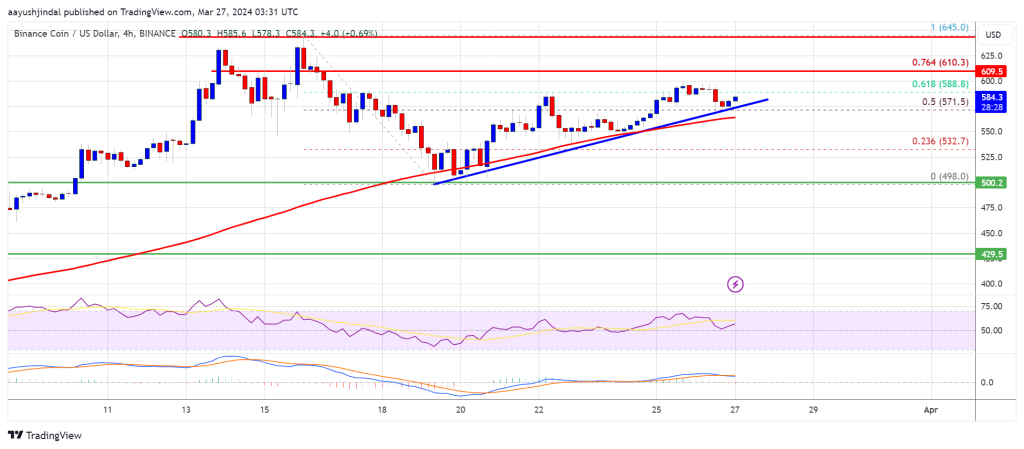
BNB価格は500ドルゾーン付近にサポートを見つけた後、新たな上昇を試みています。 588ドルと610ドルの抵抗レベルをクリアできれば、価格は強気の勢いを増す可能性がある。 BNB/USDペアの4時間足チャートには、580ドル付近にサポートを伴う主要な強気トレンドラインが形成されている。 610ドルの抵抗線を明確に超えた場合、価格は645ドルと680ドルの抵抗線レベルに向かってさらに上昇する可能性があります。
BNB price is attempting a fresh increase from the $500 zone. The price could gain bullish momentum if it clears the $588 and $610 resistance levels.
BNB価格は500ドルゾーンから新たな上昇を試みています。 588ドルと610ドルの抵抗レベルをクリアできれば、価格は強気の勢いを増す可能性がある。
- BNB price started a fresh increase above the $520 and $540 levels.
- The price is now trading above $575 and the 100 simple moving average (4 hours).
- There is a key bullish trend line forming with support near $580 on the 4-hour chart of the BNB/USD pair (data source from Binance).
- The pair could attempt a fresh rally if it clears the $610 resistance zone.
BNB Price Eyes Fresh Surge
After a downside correction from $645, BNB price found support near the $500 zone. A low was formed at $498 and the price started a fresh increase, like Ethereum and Bitcoin.
BNB価格は520ドルと540ドルのレベルを超えて新たな上昇を開始しました。価格は現在575ドルと100単純移動平均(4時間)を超えて取引されています。4時間足チャートでは580ドル付近のサポートで重要な強気トレンドラインが形成されています。 BNB/USDペア(データソースはBinance)。610ドルのレジスタンスゾーンをクリアすれば、ペアは新たな上昇を試みる可能性がある。BNB価格の目はフレッシュサージ645ドルからの下値修正後、BNB価格は500ドルゾーン付近でサポートを見つけた。安値は498ドルで形成され、価格はイーサリアムやビットコインと同様に新たな上昇を開始しました。
There was a move above the $520 and $550 resistance levels. The bulls pushed the price above the 50% Fib retracement level of the downward move from the $645 swing high to the $498 low. The price is now trading above $575 and the 100 simple moving average (4 hours).
520ドルと550ドルの抵抗レベルを超える動きがありました。強気派は価格を645ドルのスイング高値から498ドルの安値までの下降の50%Fibリトレースメントレベルを超えて押し上げた。価格は現在、575ドルと100単純移動平均(4時間)を上回って取引されている。
There is also a key bullish trend line forming with support near $580 on the 4-hour chart of the BNB/USD pair. Immediate resistance is near the $588 level. It is close to the 61.8% Fib retracement level of the downward move from the $645 swing high to the $498 low.
また、BNB/USDペアの4時間足チャートには、580ドル付近にサポート線を形成する主要な強気トレンドラインも存在する。当面の抵抗線は588ドルレベル付近です。これは、645ドルのスイング高値から498ドルの安値までの下降の61.8%Fibリトレースメントレベルに近い。

Source: BNBUSD on TradingView.com
出典: TradingView.comのBNBUSD
The next resistance sits near the $610 level. A clear move above the $610 zone could send the price further higher. In the stated case, BNB price could test $645. A close above the $645 resistance might set the pace for a larger increase toward the $680 resistance. Any more gains might call for a test of the $700 level in the coming days.
次の抵抗線は610ドルレベル付近にある。 610ドルゾーンを明確に超えた場合、価格はさらに上昇する可能性があります。前述のケースでは、BNB価格は645ドルを試す可能性があります。終値が645ドルの抵抗線を上回れば、680ドルの抵抗線に向けてさらに大きな上昇のペースが設定される可能性がある。これ以上の上昇があれば、今後数日で700ドルの水準を試すことになるかもしれない。
Another Decline?
If BNB fails to clear the $610 resistance, it could start another decline. Initial support on the downside is near the $580 level and the trend line.
さらなる下落?BNBが610ドルの抵抗線を突破できなければ、さらなる下落が始まる可能性がある。下値の最初のサポートは580ドルレベルとトレンドライン付近です。
The next major support is near the $560 level. The main support sits at $540. If there is a downside break below the $540 support, the price could drop toward the $500 support. Any more losses could initiate a larger decline toward the $450 level.
次の主要なサポートは560ドルレベル付近です。メインサポートは540ドルとなっている。 540ドルのサポートを下回る下値ブレイクがある場合、価格は500ドルのサポートに向けて下落する可能性があります。これ以上の損失が発生すると、450ドルレベルに向けてさらに大きな下落が始まる可能性があります。
Technical Indicators
テクニカル指標
4-Hours MACD – The MACD for BNB/USD is gaining pace in the bullish zone.
4時間足MACD – BNB/USDのMACDは強気ゾーンでペースを上げています。
4-Hours RSI (Relative Strength Index) – The RSI for BNB/USD is currently above the 50 level.
4 時間足 RSI (相対力指数) – BNB/USD の RSI は現在 50 レベルを超えています。
Major Support Levels – $580, $560, and $540.
メジャー サポート レベル – $580、$560、および $540。
Major Resistance Levels – $598, $610, and $640.
主要な抵抗レベル – 598 ドル、610 ドル、640 ドル。
免責事項: この記事は教育目的のみに提供されています。これは投資を購入、売却、または保有するかどうかに関する NewsBTC の意見を表すものではなく、当然のことながら投資にはリスクが伴います。投資を決定する前に、ご自身で調査を行うことをお勧めします。このウェブサイトで提供される情報は完全に自己責任でご利用ください。タグ: バイナンスコインBNB価格bnbbtcBNBUSDbnbusdt
免責事項:info@kdj.com
The information provided is not trading advice. kdj.com does not assume any responsibility for any investments made based on the information provided in this article. Cryptocurrencies are highly volatile and it is highly recommended that you invest with caution after thorough research!
If you believe that the content used on this website infringes your copyright, please contact us immediately (info@kdj.com) and we will delete it promptly.
-

- Popcat Crypto: Solana ブロックチェーンの波に乗る遊び心のあるミームコインの詳細
- 2025-01-10 20:40:24
- Popcat 暗号は、特に時価総額が最近 10 億ドルという巨額に達して以来、デジタル通貨の世界で波紋を広げています。 Solana ブロックチェーンに乗っているこの遊び心のあるミームコインは、投資家とミーム愛好家の両方の注目を集めています。市場動向が明るい兆しを見せていることから、ポップキャットがその勢いを維持し、さらなる高みに到達できるかどうかに多くの人が興味を持っている。 Popcat の魅力と、この興味深い暗号通貨の将来について詳しく見ていきましょう。
-
-

-

-

-

-

-

-


