












 |
|
 |
|
 |
|
 |
|
 |
|
 |
|
 |
|
 |
|
 |
|
 |
|
 |
|
 |
|
 |
|
 |
|
 |
|
Solana 攀升至 140 美元阻力区之上。 SOL 价格正在上涨,如果突破 155 美元阻力位,可能会获得看涨势头。
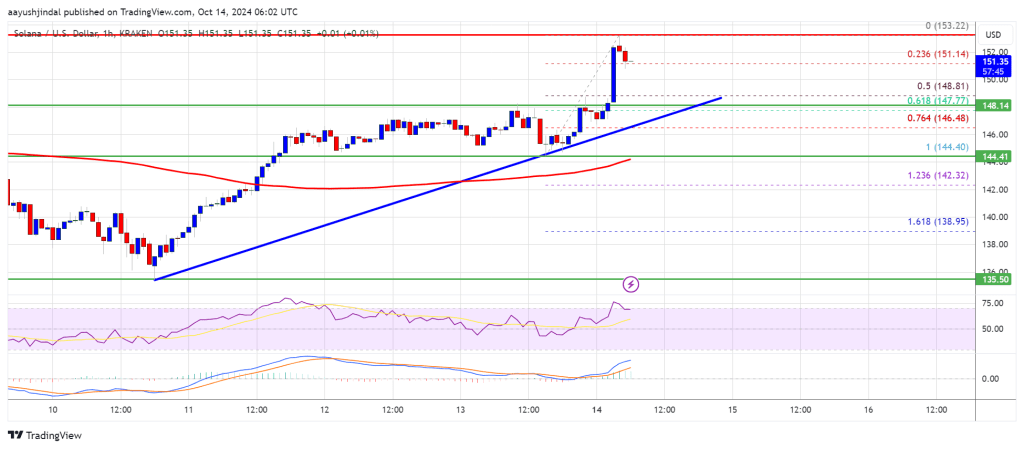
Solana (SOL) price climbed above the $140 resistance zone on Monday. Now, SOL might gain bullish momentum if it clears the $155 resistance. Key technical points:
Solana (SOL) 价格周一攀升至 140 美元阻力区上方。现在,如果 SOL 突破 155 美元阻力位,它可能会获得看涨势头。关键技术点:
Solana price showcases a continuous rise after bouncing from the $138 support.
Solana 价格从 138 美元支撑位反弹后持续上涨。
The bullish trend might face resistance at the $155 level.
看涨趋势可能会在 155 美元水平面临阻力。
A morning star pattern on the lower time frame chart adds bullish confirmation.
较低时间框架图表上的晨星图案增加了看涨确认。
Past Performance of SOL
SOL过往表现
Solana price began the week with a bullish note as the price breached the upper boundary of the Bollinger Bands on Monday. After bouncing from the $138 support last week, SOL price gained pace. Now, the bullish trend might face resistance at the $155 level.
Solana 价格在周一突破布林带上限,以看涨的姿态开启本周。继上周从 138 美元支撑位反弹后,SOL 价格上涨。现在,看涨趋势可能面临 155 美元水平的阻力。
On the other hand, the Relative Strength Index (RSI) indicator shows bullish momentum as the RSI line trades above the 50% mark. Moreover, a morning star pattern on the lower time frame chart adds bullish confirmation to the price action.
另一方面,相对强弱指数 (RSI) 指标显示出看涨势头,因为 RSI 线交投于 50% 关口上方。此外,较低时间框架图表上的晨星形态为价格走势增添了看涨确认。
Solana Technical Analysis
Solana 技术分析
As mentioned above, the price action showcases a continuous rise after bouncing from the $138 support. From the technical perspective, this bullish trend might face resistance at the $155 level. Moreover, the Fibonacci extension levels also show resistance at the same price mark.
如上所述,价格走势显示从 138 美元支撑位反弹后持续上涨。从技术角度来看,这种看涨趋势可能会在 155 美元水平面临阻力。此外,斐波那契扩展水平也显示出同一价格水平的阻力。
In case of a breakout from the $155 level, the price might rally to hit the next resistance at the 100% Fib extension levels, around the $162 mark. From there on, the morning star pattern on the lower time frame also projects a bullish target around the $175 level.
如果突破 155 美元水平,价格可能会反弹,触及 100% Fib 扩展水平的下一个阻力位,即 162 美元关口附近。从那时起,较低时间框架的晨星形态也预测了 175 美元水平附近的看涨目标。
On the flip side, if the buyers fail to keep up the bullish momentum, the price might correct lower to find support at the 23.6% Fib retracement level, around the $147.50 level. A further跌势跌至138美元支撑位附近。
On the flip side, if the buyers fail to keep up the bullish momentum, the price might correct lower to find support at the 23.6% Fib retracement level, around the $147.50 level. A further跌势跌至138美元支撑位附近。
Technical Indicator Movements
技术指标变动
Hourly MACD – The MACD (Moving Average Convergence Divergence) for SOL/USD is gaining pace in the bullish zone.
每小时 MACD – SOL/USD 的 MACD(移动平均线收敛分歧)正在看涨区域加速。
Hourly RSI – The RSI (Relative Strength Index) for SOL/USD is above the 50 level.
每小时 RSI – SOL/USD 的 RSI(相对强度指数)高于 50 水平。
Major Support Levels – $147.50 and $144.40.
主要支撑位 – 147.50 美元和 144.40 美元。
Major Resistance Levels – $155 and $162.
主要阻力位 – 155 美元和 162 美元。
免责声明:info@kdj.com
所提供的信息并非交易建议。根据本文提供的信息进行的任何投资,kdj.com不承担任何责任。加密货币具有高波动性,强烈建议您深入研究后,谨慎投资!
如您认为本网站上使用的内容侵犯了您的版权,请立即联系我们(info@kdj.com),我们将及时删除。
-

- 联邦调查局 (FBI) 扰乱哈马斯加密筹款:恐怖主义融资扰乱的新时代
- 2026-09-04 08:05:01
- 联邦调查局再次查获了与哈马斯有关的加密基础设施,拦截了捐款,并强调数字资产并不是非法融资的盾牌。
-
-
- 山寨币 100 倍狩猎:挖掘炒作之外被忽视的山寨币
- 2026-09-04 07:45:01
- 投资者正在将注意力从转瞬即逝的趋势转向山寨币市场的有形指标,关注具有坚实基础的潜在 100 倍收益的项目。
-
- XRP 与比特币:解析第四季度的模式和潜在的轮换
- 2026-09-04 04:05:01
- 通过分析 XRP 与比特币的历史表现,本报告强调了第四季度反复出现的模式以及资本转向 XRP 的潜力。
-
-
-
-
-


