













 |
|
 |
|
 |
|
 |
|
 |
|
 |
|
 |
|
 |
|
 |
|
 |
|
 |
|
 |
|
 |
|
 |
|
 |
|
数週間にわたる力強い上昇の後、XRP価格はなんとか2.4ドル付近で安定しました。これはXRPが新たなサポートレベルを見つけたことを示しているため、表面的には明るい兆しのように見えます。しかし、すべての投資家が楽観的であるわけではありません。
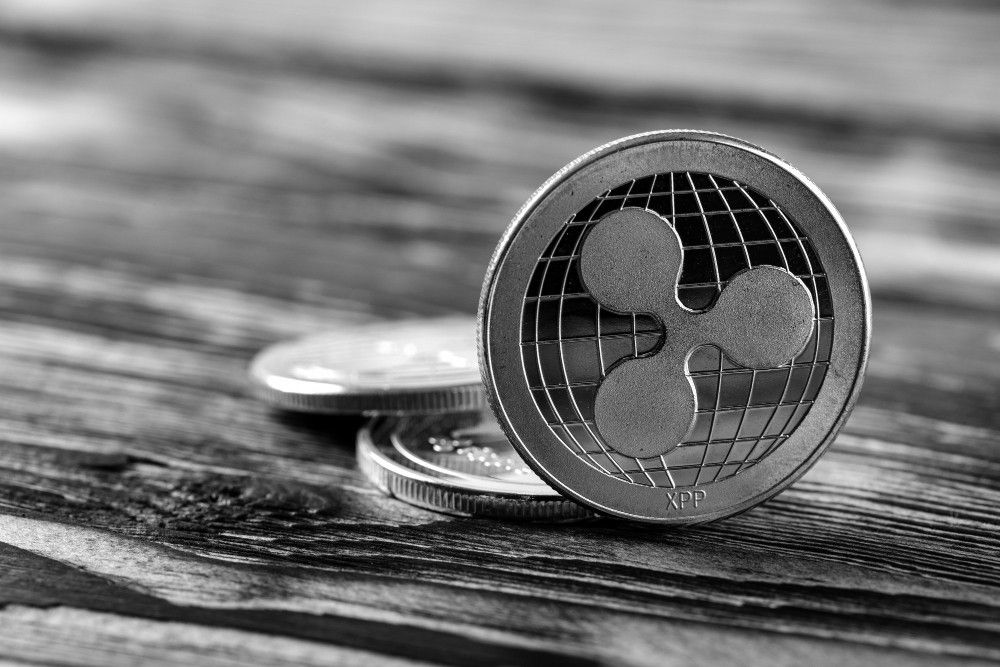
The XRP price has managed to stabilize around $2.4 after a week of major market movements. While XRP is showing signs of strength, the broader market is still up in the air.
XRP価格は、1週間にわたる市場の大きな変動の後、なんとか2.4ドル付近で安定しました。 XRPが強さの兆しを見せている一方で、より広範な市場はまだ宙に浮いている。
With Bitcoin struggling to stay above $100K, investors are now wondering what’s next for XRP. Could the recent XRP flash crash be a sign of an upcoming market correction?
ビットコインが10万ドルを超えるのに苦戦する中、投資家は現在XRPの次はどうなるのか疑問に思っている。最近のXRPフラッシュクラッシュは今後の市場調整の兆候でしょうか?
Let’s take a closer look at the XRP price movements and see what the technical analysis reveals.
XRPの価格変動を詳しく見て、テクニカル分析で何が明らかになるかを見てみましょう。
XRP Price Analysis – XRP Price Stabilizes at $2.4
XRP価格分析 – XRP価格は2.4ドルで安定
After surging by over 400% in six months and hitting a new 2023 high of $2.4, XRP has shown impressive resilience despite the recent market turbulence. However, this stability might be short-lived as technical analysis suggests a potential downtrend in the coming weeks.
XRPは6か月で400%以上急騰し、2023年の新高値である2.4ドルを記録した後、最近の市場の混乱にもかかわらず、目覚ましい回復力を示しました。ただし、テクニカル分析では今後数週間で潜在的な下降傾向が示唆されているため、この安定性は短命である可能性があります。
After falling below the 21-day Simple Moving Average (SMA 21), XRP is now trading at a crucial support level. If XRP fails to hold this support, it could trigger a sell-off, pushing the price down further.
XRPは21日間単純移動平均(SMA 21)を下回った後、現在重要なサポートレベルで取引されています。 XRPがこのサポートを維持できない場合、売りが発生し、価格がさらに下落する可能性があります。
On the other hand, if XRP manages to bounce back up and reclaim the SMA 21, it could signal a continuation of the bullish trend, potentially leading to a new all-time high.
一方で、XRPが何とか立ち直ってSMA 21を取り戻すことができれば、強気トレンドの継続を示す可能性があり、史上最高値を更新する可能性があります。
Key Support and Resistance Levels to Watch
注目すべき主要なサポートとレジスタンスのレベル
The XRP price movements are facing several crucial support and resistance levels:
XRPの価格変動は、いくつかの重要なサポートレベルとレジスタンスレベルに直面しています。
XRP/USD 45-mins chart - TradingView
XRP/USD 45分チャート - TradingView
XRP Price Analysis – What’s Next for XRP?
XRP 価格分析 – XRP の次は何ですか?
Many analysts are now predicting that the XRP price could head lower in the coming weeks. After falling below its 21-day Simple Moving Average (SMA 21), XRP is flashing a bearish signal.
多くのアナリストは現在、XRP価格が今後数週間で下落する可能性があると予測している。 21日間の単純移動平均(SMA 21)を下回った後、XRPは弱気シグナルを点滅させています。
The SMA 21 is a key technical indicator that traders use to gauge the market trend. When the price moves below this level, it’s often a sign that selling pressure is increasing. This is exactly what’s happening with XRP.
SMA 21 は、トレーダーが市場トレンドを測定するために使用する重要なテクニカル指標です。価格がこのレベルを下回った場合、多くの場合、売り圧力が高まっていることを示しています。これはまさにXRPで起こっていることです。
Here’s a breakdown of the key support and resistance levels to watch:
注目すべき主要なサポートレベルとレジスタンスレベルの内訳は次のとおりです。
1. Support: The first key support level is at $2, followed by $1.8. If XRP fails to hold above these levels, it could trigger a sell-off, pushing the price down further.
1. サポート: 最初の主要なサポート レベルは 2 ドルで、次に 1.8 ドルです。 XRPがこれらのレベルを超えて維持できない場合、売りが引き起こされ、価格がさらに下落する可能性があります。
2. Resistance: The first key resistance level is at $2.4, followed by $2.8. If XRP manages to break through these levels, it could continue to rally, potentially reaching new highs.
2. レジスタンス: 最初の主要なレジスタンスレベルは 2.4 ドルで、次に 2.8 ドルです。 XRPがこれらのレベルを突破できれば、上昇を続け、新たな高値に達する可能性があります。
3. Key Factor: The performance of Bitcoin will play a major role in determining XRP’s next move. If Bitcoin drops below $100K, it’s likely that XRP will also face increased selling pressure.
3. 重要な要素: ビットコインのパフォーマンスは、XRP の次の動きを決定する上で大きな役割を果たします。ビットコインが10万ドルを下回れば、XRPも売り圧力が高まる可能性が高い。
免責事項:info@kdj.com
提供される情報は取引に関するアドバイスではありません。 kdj.com は、この記事で提供される情報に基づいて行われた投資に対して一切の責任を負いません。暗号通貨は変動性が高いため、十分な調査を行った上で慎重に投資することを強くお勧めします。
このウェブサイトで使用されているコンテンツが著作権を侵害していると思われる場合は、直ちに当社 (info@kdj.com) までご連絡ください。速やかに削除させていただきます。


