
















 |
|
 |
|
 |
|
 |
|
 |
|
 |
|
 |
|
 |
|
 |
|
 |
|
 |
|
 |
|
 |
|
 |
|
 |
|
THETA/USDTは顕著な強気相場を続けており、最近では3.172ドルまで上昇し、その後現在の価格である2.886ドルまで下落しました。
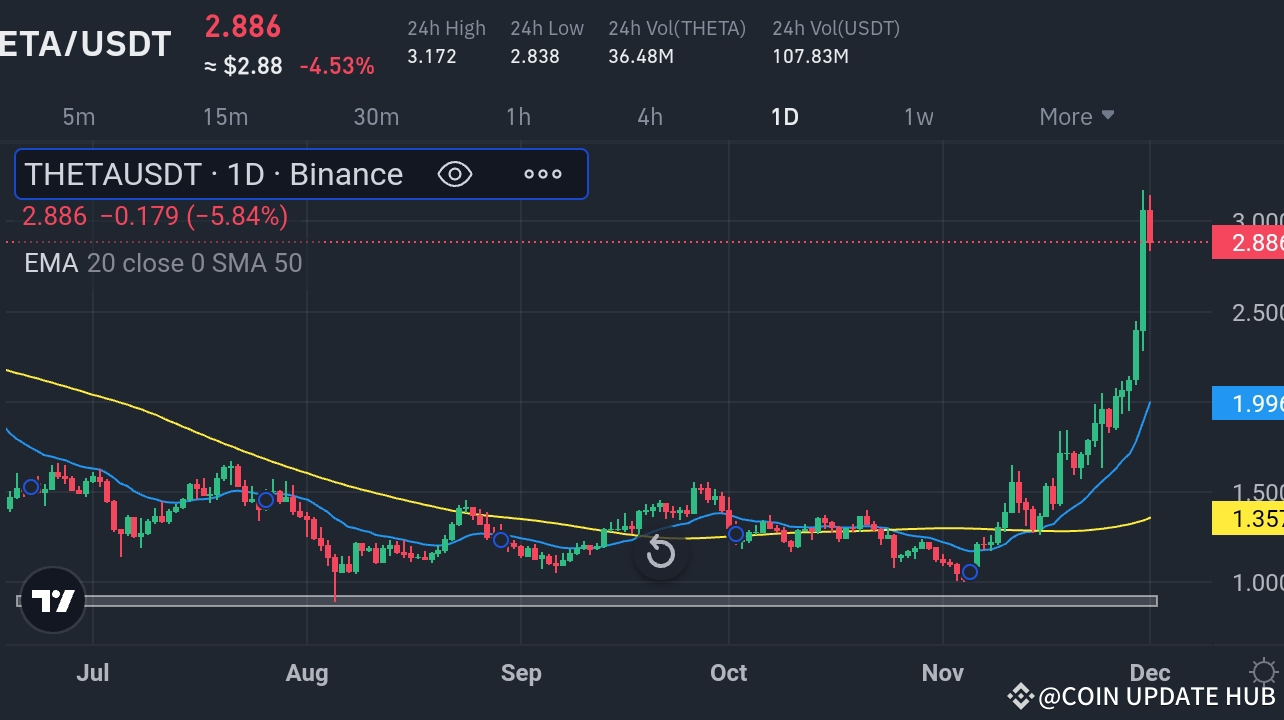
THETA price analysis shows that the coin experienced a significant pullback on Friday, pausing its impressive rally. Despite the pullback, THETA price analysis remains bullish on higher timeframes.
THETAの価格分析によると、金曜日にコインは大幅な下落を経験し、その印象的な上昇は一時停止した。反落にもかかわらず、THETAの価格分析はより高い時間枠では引き続き強気です。
---
---
THETA price analysis: a closer look at today’s trends
THETA価格分析:今日のトレンドを詳しく見る
After several days of remarkable gains, THETA price encountered its first substantial retracement on Friday. The coin opened the day at $2.967 before embarking on a rollercoaster ride that saw it reach a high of $3.172 and a low of $2.833. At the time of writing, THETA is trading at $2.886, down by 5.84% on the day.
数日間の顕著な上昇の後、金曜日にTHETA価格は初めて大幅なリトレースメントに遭遇しました。このコインは2.967ドルでその日を開始し、ジェットコースターに乗り出し、高値は3.172ドル、安値は2.833ドルに達しました。本稿執筆時点で、THETAは当日5.84%安の2.886ドルで取引されている。
---
---
A glance at the 24-hour price chart reveals that THETA price began the day with a bullish note, continuing its rally from Thursday. The coin price surged past the $3.00 resistance level like a hot knife through butter, reaching as high as $3.172. However, buying pressure encountered resistance at this point, triggering a pullback in THETA price.
24時間の価格チャートを見ると、THETAの価格はその日強気で始まり、木曜日から上昇を続けていることがわかります。コインの価格はバターに熱したナイフのように3.00ドルの抵抗水準を超えて急騰し、3.172ドルまで上昇した。しかし、この時点で買い圧力が抵抗に遭い、THETA価格の下落を引き起こしました。
---
---
The coin price then dropped sharply, reaching a low of $2.833 before finding some support. From there, THETA price recovered slightly to reach the $2.886 price point, where it encountered another wave of selling pressure. This ultimately led to the coin price pulling back further from its intraday high.
その後、コイン価格は急落し、サポートを見つける前に2.833ドルの安値に達しました。そこから、THETAの価格はわずかに回復して2.886ドルの価格ポイントに達しましたが、そこで再び売り圧力の波に遭遇しました。これにより、最終的にコイン価格は日中の高値からさらに後退することになりました。
---
---
A look at the technical indicators reveals that the coin price is still trading at a distance from the EMA 20, which is positioned at $1.996. This indicates that bullish momentum still dominates in the short term. However, the larger the gap from this moving average, the more likely we are to see a mean-reversion or consolidation phase.
テクニカル指標を見ると、コイン価格はまだ1.996ドルに位置するEMA 20から離れた位置で取引されていることがわかります。これは、短期的には依然として強気の勢いが優勢であることを示しています。ただし、この移動平均からのギャップが大きければ大きいほど、平均値への回帰または保ち合いの段階が見られる可能性が高くなります。
---
---
Meanwhile, THETA price remains well above the SMA 50, which currently stands at $1.357. This simple moving average highlights the longer-term trend, which is bullish.
一方、THETAの価格は現在1.357ドルであるSMA 50をはるかに上回っています。この単純移動平均は、長期的な強気傾向を強調しています。
---
---
Overall, THETA price analysis is bullish on the weekly and monthly charts despite today’s pullback. The coin price is still up by an impressive 200% on the month and shows no signs of slowing down just yet.
全体として、THETAの価格分析は、今日の反動にもかかわらず、週足チャートと月足チャートでは強気です。コイン価格は依然として同月比 200% という驚異的な上昇を続けており、まだ減速の兆しはありません。
---
---
Key technical levels to consider for THETA price analysis
THETAの価格分析で考慮すべき主な技術レベル
Current Price: $2.886
現在の価格: $2.886
EMA 20: $1.996
EMA 20: 1.996 ドル
SMA 50: $1.357
SMA 50: 1.357 ドル
Relative Strength Index (RSI): 76.64
相対強度指数 (RSI): 76.64
---
---
Disclaimer: This analysis is intended to provide information and does not constitute investment advice. Trading cryptocurrencies involves significant risk, and you should always do your own research and consult a qualified financial advisor before making any trades.
免責事項: この分析は情報提供を目的としており、投資アドバイスを構成するものではありません。暗号通貨の取引には重大なリスクが伴うため、取引を行う前に必ず自分で調査し、資格のある財務アドバイザーに相談する必要があります。
免責事項:info@kdj.com
提供される情報は取引に関するアドバイスではありません。 kdj.com は、この記事で提供される情報に基づいて行われた投資に対して一切の責任を負いません。暗号通貨は変動性が高いため、十分な調査を行った上で慎重に投資することを強くお勧めします。
このウェブサイトで使用されているコンテンツが著作権を侵害していると思われる場合は、直ちに当社 (info@kdj.com) までご連絡ください。速やかに削除させていただきます。


