


 C2C C2C Purchase USDT Experience Sharing (Use RMB to Buy USDT): Buy U can withdraw the currency immediately (Does not require T+1) #Ouyi Sustainable, #How to Buy US Stocks in China #How to Register for Ouyi#Coin")

![🔴Bitcoin Ether plummeted! Great opportunity to buy at the bottom! [3/10]](/uploads/2025/03/11/cryptocurrencies-news/videos/bitcoin-ether-plummeted-opportunity-buy-bottom/image-1.jpg "🔴Bitcoin Ether plummeted! Great opportunity to buy at the bottom! [3/10]")


 |
|
 |
|
 |
|
 |
|
 |
|
 |
|
 |
|
 |
|
 |
|
 |
|
 |
|
 |
|
 |
|
 |
|
 |
|
Cryptocurrency News Video
Bitcoin plummeted rapidly in the early morning of 2024.12.19, and the daily line has not bottomed out yet! When can I buy a copycat?
Dec 19, 2024 at 02:13 am 比特币队长Captain
Assistant only telegram: bpq2020 (note bpq2020Msg is a scam!) Click the link to add assistant telegram: https://t.me/bpq2020 The Bitcoin market changes in real time. What we can do is to analyze the next trend with a higher probability based on the current structure, so as to make a trading plan with an appropriate profit and loss ratio. Generally, there are top and bottom structures (double bottom, triangle, head and shoulders bottom, Arc bottom, V bottom) are easy for retail investors to identify and have a high probability of getting out of the band. The pursuit of grabbing the band is the core password for continuously and stably outperforming the market. Summary of my 8 years of Bitcoin trading experience: superstitious analysis, blindly following operations, firm belief, and high-power stud will surely lead to financial freedom as soon as possible! I wish all my friends who follow me good luck! [About the analysis timeline] 1H corresponds to a 1-3 day cycle, and the band corresponds to an amplitude of about $2,000. 4H corresponds to the 7-20 day cycle, and the band corresponds to the range of about $5,000. The daily line corresponds to the 20-2 month cycle, and the band corresponds to the range of about $10,000. The weekly line corresponds to a 3-6 month cycle, and the band corresponds to a range of about $30,000. [About analysis of commonly used indicators] 1. Cloud chart (Ichimoku), default parameters, commonly used leading band A, leading band B, use this indicator to determine the level corresponding to the top and bottom structure, and the trend direction. This indicator is the main reference, except You can search for free indicator explanations on Youtube, and we also have advanced paid course study guidance. 2. MACD, the default parameter, is often used to judge divergence and is an auxiliary reference. 3. Trading volume is often used to judge the strength of the end of the trend as an auxiliary reference. All comments in the video and this article do not constitute any investment advice! For learning and exchange purposes only. #Bitcoin#Bitcoin Quotes#BTC #BTC Quotes#Speculation Skills#Speculation Strategy#Speculation Experience#Bitcoin Quotes#CaptainBitcoin#CaptainBTC #Bitcoin Mining#Bitcoin Captain#Bitcoin Captain
Disclaimer:info@kdj.com
The information provided is not trading advice. kdj.com does not assume any responsibility for any investments made based on the information provided in this article. Cryptocurrencies are highly volatile and it is highly recommended that you invest with caution after thorough research!
If you believe that the content used on this website infringes your copyright, please contact us immediately (info@kdj.com) and we will delete it promptly.
-
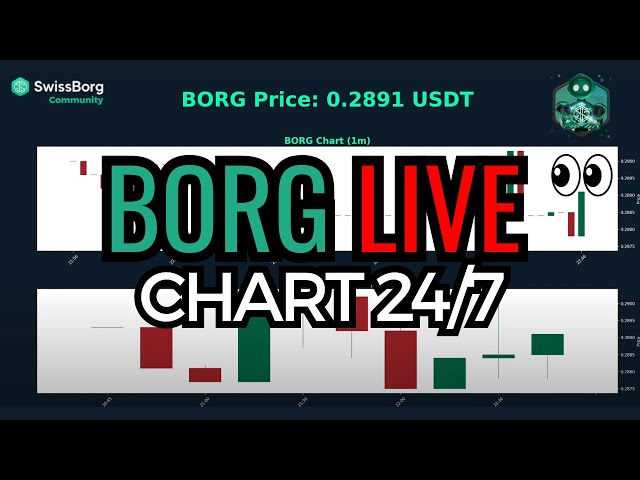
- 🟢 $ Borg Live Price - Swissborg $ Sol Token Crypto Chart 24/7 Borg/USDT 📊🚀
- Mar 11, 2025 at 01:43 pm Borg Live Price
- Watch the live price action of $BORG, the SwissBorg token built on Solana, updating in real-time. Stay tuned to track every movement, pump, or dip as it happens! 🔹 Live price updates 🔹 Real-time...
-

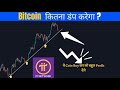
- A bloody collapse! The global plummet, the US stock market is about to break, and the historical 3.12 plunge reappears? The gap is filled, and the weekly line supports the last line of defense! Where can I buy a bear in full? Analysis of Bitcoin Market on
- Mar 11, 2025 at 01:42 pm 比特币欧阳
- 💹Telegram free group: https://t.me/BTCouyang 💹Telegram Telegram private chat: https://t.me/ouyang77777 Welcome to subscribe to my channel: https://www.youtube.com/channel/UCzZ49DculfIZv6W1X81pLlQ?sub_confirmation=1 -----------------------------------------------------------------------------------------------------------------------------------------------------------------------------------------------------------------------------------------------------------------------------------------------------------------------------------------------------------------------------------------------------------------------
-
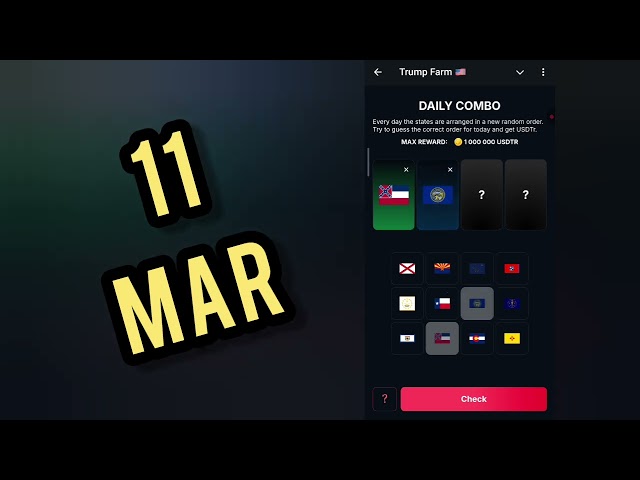
- Trump Farm Daily Combo 11 March February | Today Trum Farm Daily Combo | Trump Farm | AGP
- Mar 11, 2025 at 01:42 pm ALL GAMER PRO
- Trump Farm Daily Combo 11 March February | Today Trum Farm Daily Combo | Trump Farm | AGP trump farm daily combo trump farmers trump farm show trump farm airdrop listing date trump farm...
-

- Pi Coin 10$ Soon | Pi Network New updates | Pi Coin payment accept by zito realty llc | Pi future
- Mar 11, 2025 at 01:41 pm Aizaz Engineer
- Pi network :- https://minepi.com/aizazengineer Binance registration link :- https://accounts.binance.info/register?ref=960369002&utm_medium=app_share_link_telegram 3rd Channel Link :- https:/...
-
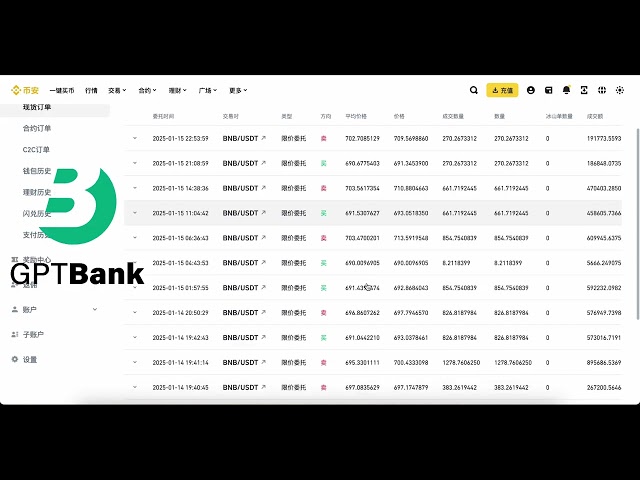
- USDT trading platform. How to buy ok coins in China in 2024 (how to buy ok coins in RMB) #Buy usdt|#Is it illegal to buy bitcoin? #Ouyi Exchange registration#Bitcoin purchasing platform, #virtual currency trading|#How to buy bitcoin in mainland China. #Di
- Mar 11, 2025 at 01:41 pm 币圈vip资讯
- 📢📢📢 Ouyi OKX registration link [up to 20% commission rebate] 📢📢📢 📢 https://www.okx.com/join/OKGEGE 📢📢📢 🔒 🔒 🔒 🔒 Use ↗️⬆️↖️ Link registration can get 100 yuan Bitcoin🔒 🔒 🔒 🔒 🔒 🔒 🔒 🔒 Join the senior brother's currency trading exchange group to learn more knowledge🔒 🔒 🔒 🔒 🔒 🔒 🔒 🔒 🔒 🔒 🔒 🔒 🔒 🔒 🔒 🔒 🔒 🔒 🔒 🔒 🔒 🔒 🔒 🔒 🔒 🔒 🔒 ✈️✈️✈️ Tutorial for using automatic arbitrage robot: https://...
-
- Live Trading: Will Bitcoin Pump Now? , Pi Coin Buying Point? , Pi coin news
- Mar 11, 2025 at 01:41 pm Crypto TA King
- Twitter- https://x.com/CryptoTA_King Telegram- https://telegram.me/joinchat/OqU9tbJPt7Y3ZWJl #Bitcoin #Crypto #PI Disclaimer : "This video is for informational purposes only and does not...
-
-

-
- Pi Network Withdrawal Full Process | How to Withdraw Pi Network | Pi Network Withdrawal Kaise Kare
- Mar 11, 2025 at 01:36 pm KingPin
- Pi Network Withdrawal Full Process | How to Withdraw Pi Network | Pi Network Withdrawal Kaise Kare In this video we'll guide you about how to withdraw pi network tokens and full withdrawal process...
