


 |
|
 |
|
 |
|
 |
|
 |
|
 |
|
 |
|
 |
|
 |
|
 |
|
 |
|
 |
|
 |
|
 |
|
 |
|
Cryptocurrency News Video
2025.3.17 Bitcoin’s small double bottom breakthrough failed to form a temptation to attract long positions. Look at the pullback in the future, and it is suitable for high selling!
Mar 17, 2025 at 02:01 am 比特币队长Captain
Assistant's only telegram: bpq2020 (Note that bpq2020Msg is a liar!) Click the link to add Assistant's telegram: https://t.me/bpq2020 Bitcoin's real-time changes, what can be done is to analyze the next trend with a higher probability based on the current structure, and thus make a trading plan with a suitable profit-loss ratio. Generally, there is a top-bottom structure (double bottom, triangle, head and shoulder bottom, arc bottom, V bottom) which is easy for retail investors to identify and are likely to get out of the band. The pursuit of grabbing the band is the core password for continuous and stable outperforming the market. Summary of my 8 years of Bitcoin trading experience: superstitious analysis, blindly following operations, firm belief, high-powered Soha will definitely lose money as soon as possible! I wish all my friends who follow me good luck and always accompany you! [About the analysis timeline] 1H corresponds to a 1-3-day cycle, and the band corresponds to an amplitude of about US$2,000. 4H corresponds to a 7-20-day cycle, and the band corresponds to an amplitude of about US$5,000. The daily line corresponds to a 20-2-month cycle, and the band corresponds to an amplitude of about US$10,000. The weekly line corresponds to a 3-6-month cycle, and the band corresponds to an amplitude of about US$30,000. [About the analysis of common indicators] 1. Cloud diagram (one-picture balance table Ichimoku), default parameters, commonly used first-hand belt A and first-hand belt B. Use this indicator to determine the corresponding level of the top and bottom structure and the trend direction. This indicator is the main reference. In addition to searching for free indicator explanations on Youtube, we also have advanced paid course learning guidance. 2. MACD, the default parameter, is often used to judge deviations and assist in reference. 3. Trading volume is often used to judge the strength at the end of the trend and assist in reference. All the comments in this video and this article do not constitute any investment advice! For learning and communication only. #Bitcoin#Bitcoin Quotation#BTC#BTC#Crime Techniques#Crime Speculation Strategy#Crime Speculation Experience#Bitcoin Quotation#Captain Bitcoin#CaptainBTC#Bitcoin Mining#Bitcoin Captain#Bitcoin Captain
Disclaimer:info@kdj.com
The information provided is not trading advice. kdj.com does not assume any responsibility for any investments made based on the information provided in this article. Cryptocurrencies are highly volatile and it is highly recommended that you invest with caution after thorough research!
If you believe that the content used on this website infringes your copyright, please contact us immediately (info@kdj.com) and we will delete it promptly.
-

- Getting the hunt token in natural disaster by surviving 3 times and a bonus
- Mar 19, 2025 at 10:12 am anonymousgames
-

- The 3.19th cryptocurrency circle collapsed again! Is 2025 a bear market? Pi coins collapsed too! How to make Dogecoin and altcoins?
- Mar 19, 2025 at 10:11 am 迷男说投资
- Telegram channel: https://t.me/Minanshuotouzi8 Discord channel https://discord.gg/9pZREUMfeX telegram private message: t.me/minanshuotouzi QQ: 3195820366 WeChat public account Fannan said that investment will be added and joined Binance https://accounts.binance.com/register?ref...
-
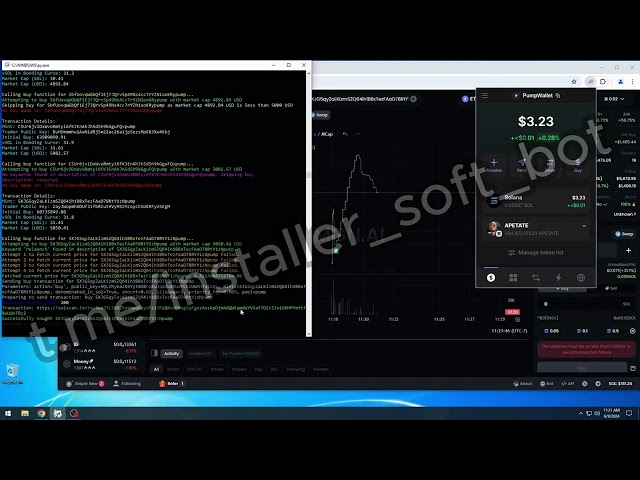
- SOL Sniper Bot Ultimate Solana Trading Bot Fastest Crypto Sniping Tool!
- Mar 19, 2025 at 10:09 am Anthony Allen
- 🚀 SOL Sniper Bot | The Ultimate Solana Trading Tool | Fast & Secure Crypto Sniper! 💰 🔥 Maximize Your Gains with This Solana Trading Bot! Unlock the power of high-speed trading with the SOL Sniper Bot...
-

-
-

- 🔥 Is the 1 oz Silver Kangaroo Coin WORTH the HYPE?! 🇦🇺 Details Inside! 🚀
- Mar 19, 2025 at 10:04 am Coinsdrop
- 🔥 Is the 1 oz Silver Kangaroo Coin WORTH the HYPE?! 🇦🇺 Details Inside! 🚀 Is the 1 oz Australian Silver Kangaroo Coin truly the best silver bullion investment? 🤔 In this video, we dive deep into its...
-
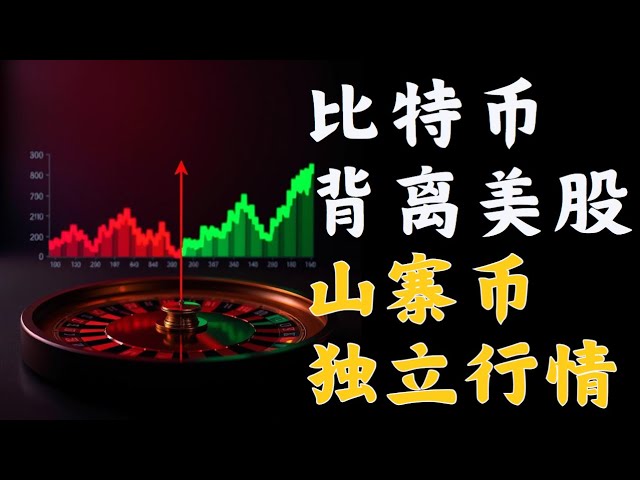
- US stocks rebounded on March 19, but Bitcoin stopped following? Only when the decline is below 80,000? Ethereum 1790 is the bottom? If you buy altcoins and increase the other, it’s already irritating! ! ! Is Bitcoin’s divergence from US stocks an opportun
- Mar 19, 2025 at 10:03 am 币圈博主🚩会员群搬运
- 💹 Telegram Personal Telegram: https://t.me/Tarderfengge 💹 QQ: 158241758 💹 Telegram Free Group: https://t.me/FengegeBtc ——————————————————————————————————————————— Our community is a cryptocurrency blogger member group content transfer sharing broadcast for 4 years. Welcome to join the video chapter: 0:00 Introduction 0:36 Introduction to Bitcoin Ethereum 01:19 Bitcoin...
-

- Pepe COIN | Price Prediction & Technical Analysis [ IMPORTANT 24 HOURS ! ]
- Mar 19, 2025 at 10:03 am Adam coins
- DISCORD : https://discord.gg/zknhD6Fc 🚀 Pepe COIN is EXPLODING! In this video, we dive deep into the latest price prediction and technical analysis for Pepe COIN, the cryptocurrency that’s taking...
-
- BREAKING: SHIBARIUM WILL SEND SHIBA INU TO $35 OVERNIGHT! SHIBA INU COIN NEWS! SHIB PRICE PREDICTION
- Mar 19, 2025 at 10:03 am Doctor Crypto
- BREAKING: SHIBARIUM WILL SEND SHIBA INU TO $35 OVERNIGHT! SHIBA INU COIN NEWS! SHIB PRICE PREDICTION #shibainu #shibarmy #shibainupriceprediction #shibariumnews #cryptodog #shibariumlaunchdate ...