

















 |
|
 |
|
 |
|
 |
|
 |
|
 |
|
 |
|
 |
|
 |
|
 |
|
 |
|
 |
|
 |
|
 |
|
 |
|
Cryptocurrency News Articles
DOGS Coin: A Technical Analysis to Uncover the Coin's Potential
Oct 19, 2024 at 11:04 am
DOGS, a coin in the world of meme-inspired cryptocurrencies, is currently in an interesting position. After a series of dips and minor recoveries, DOGS is showing signs of potential movement, but the real question is—what's next?
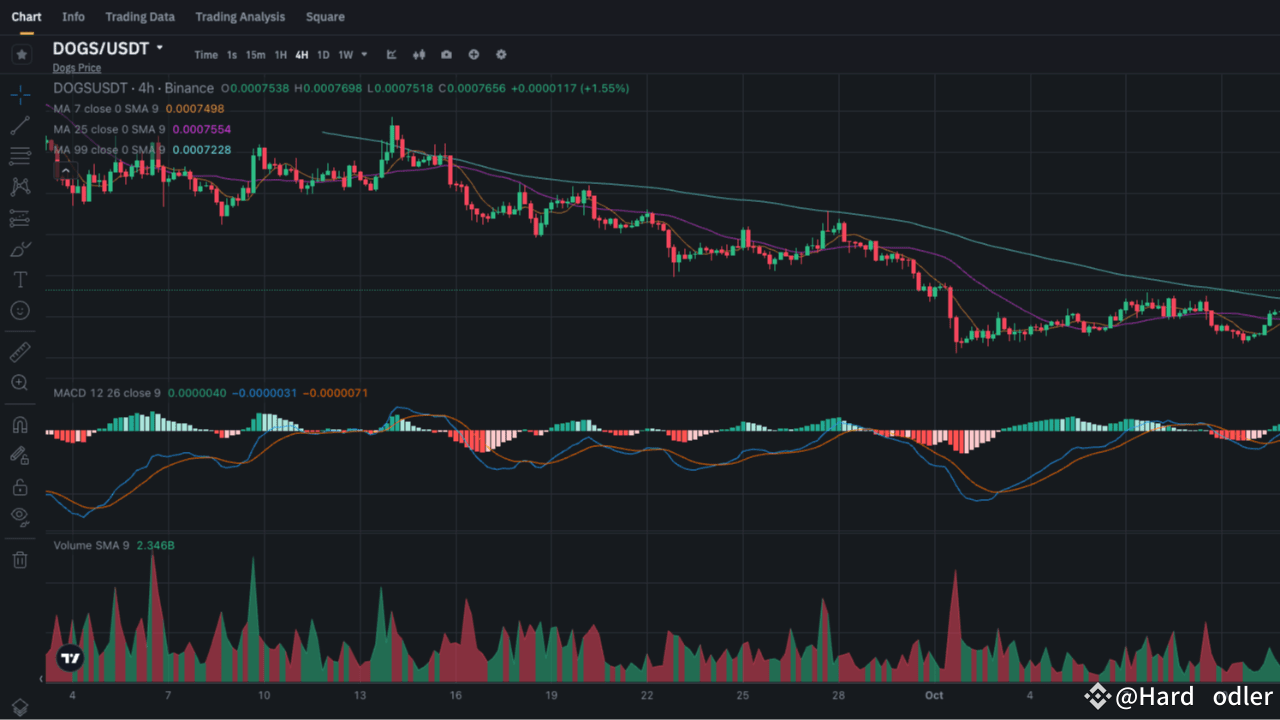
DOGS coin, a meme-inspired cryptocurrency, has been making waves among traders and investors alike. After a series of dips and minor recoveries, DOGS is currently showing signs of potential movement, leaving many wondering what’s next for this meme coin.
Is DOGS preparing for a strong breakout or simply taking a breather before continuing its sideways trend? Let’s break down the 4-hour chart and explore what the future might hold for DOGS coin traders and investors.
Technical Analysis: Key Indicators for DOGS
A glance at DOGS' current price action on the 4-hour chart reveals that it is hovering around 0.00007656. While the coin hasn't made any explosive moves recently, there are several signals that warrant attention. Let's dive into the moving averages, MACD, and volume trends to get a clearer picture.
Moving Averages (MAs): At the time of writing, DOGS is trading just above its 7-period simple moving average (SMA), which is at 0.00007498, and slightly above the 25-period SMA, which lies at 0.00007554. These shorter-term SMAs indicate that while DOGS has managed to pull back from its recent lows, it is still vulnerable to downward pressure if buyers don't step in.
However, the 99-period SMA, located at 0.00007228, is still acting as a significant support level. This level has been tested multiple times over the last few weeks, and each time it has held strong. This means that for DOGS to continue its upward journey, it needs to clear the immediate resistance at 0.0000765 and maintain its momentum above 0.000080 to ensure a more sustained rally.
MACD (Moving Average Convergence Divergence): The MACD indicator is showing signs of improvement, but we're not out of the woods yet. The MACD line is just crossing above the signal line, with the histogram printing some green bars, indicating that the bearish momentum may be fading. If the MACD continues to build positive momentum, it could signal a stronger bullish reversal. However, we need to watch for confirmation as the MACD lines are still close together, suggesting caution is warranted.
Volume: One of the more concerning aspects of this chart is the relatively low trading volume. The Volume SMA sits at 2.34B, but there hasn't been any major spike in buying or selling pressure in recent sessions. This low volume suggests a lack of conviction in the market. If DOGS is going to break through its resistance levels, we'll need to see a noticeable uptick in volume to confirm the breakout. Without it, the coin could continue to range between 0.000075 and 0.000077 in the near term.
Support and Resistance Levels
Understanding the key levels DOGS must break or hold is crucial for both short-term traders and long-term investors. Here's what we need to focus on:
Resistance Levels: DOGS is facing its first major resistance at 0.0000765. If the price can break above this level and close with strong volume, we could see DOGS test 0.000080 and beyond. The next significant resistance would then be around 0.000085, which is a psychological barrier as well as a previous high from early October. Breaking past 0.000085 could open the doors for DOGS to rally towards 0.000090 and beyond.
Support Levels: On the downside, DOGS has been holding the 0.000072 level quite well, which corresponds to the 99-period SMA. This has acted as a strong floor for the coin, and if DOGS were to drop below this, we could see a more extended pullback to 0.000070 or even 0.000068, which would signify a deeper correction. Traders should watch these levels closely, as breaking below 0.000072 could trigger further selling pressure.
What Could Drive DOGS’ Price?
Meme coins like DOGS are often driven by speculative trading, social media hype, and overall market sentiment. While DOGS doesn't have the same mainstream attention as Dogecoin or Shiba Inu, it can still benefit from the broader meme coin trend. Here are a few factors that could affect DOGS' price in the coming days:
Market Sentiment: The broader crypto market sentiment plays a huge role in how meme coins perform. If Bitcoin and other large caps continue to rise, DOGS could benefit from a "rising tide lifts all boats" scenario. On the other hand, if the market turns bearish, DOGS could struggle to maintain its current support
Disclaimer:info@kdj.com
The information provided is not trading advice. kdj.com does not assume any responsibility for any investments made based on the information provided in this article. Cryptocurrencies are highly volatile and it is highly recommended that you invest with caution after thorough research!
If you believe that the content used on this website infringes your copyright, please contact us immediately (info@kdj.com) and we will delete it promptly.
-

-
- Consensus 2026 Miami: Web3, Blockchain, Cryptocurrency, NFTs, Metaverse, Conference, May 5th — Where Wall Street Meets the Digital Frontier
- May 01, 2026 at 11:27 pm
- Miami buzzes as Consensus 2026 approaches on May 5th, highlighting Web3, blockchain, crypto, NFTs, and the metaverse's shift from hype to institutional and sustainable reality.
-
-
- Bitcoin Miners Electrify the Grid: Ohio Gas Plant Acquisition Powers Up a New Era for Digital Gold
- Apr 30, 2026 at 10:38 pm
- The Bitcoin mining industry is undergoing a significant transformation, with major players aggressively expanding operations and strategically acquiring energy assets like Ohio gas plants to solidify their future in the digital economy.
-
-
- Solana's Slippery Slope: Price Prediction Points to Resistance Loss and Potential Further Drops
- Apr 30, 2026 at 09:08 pm
- Solana is struggling to break key resistance, signaling potential downside. Repeated rejections at $86-$88, coupled with a broken short-term pattern, point to targets as low as $67, or even $40, as sellers maintain control. Investors should watch critical support levels closely.
-
-
- NYC's New Beat: Staking Systems, USD1, and Governance Drive Crypto's Next Wave
- Apr 30, 2026 at 03:02 pm
- From lucrative USD1 earning events to robust governance models, the crypto sphere is buzzing with innovations reshaping how we engage with digital assets, focusing on long-term commitment and stablecoin utility.
-
- OKX Unveils Agent Payments Protocol: Ushering in a New Era of AI Transactions
- Apr 30, 2026 at 02:53 pm
- OKX launches its Agent Payments Protocol (APP), an open standard for AI-driven commerce, enabling agents to manage full business cycles. Explore the implications for AI transactions and agentic payments.





