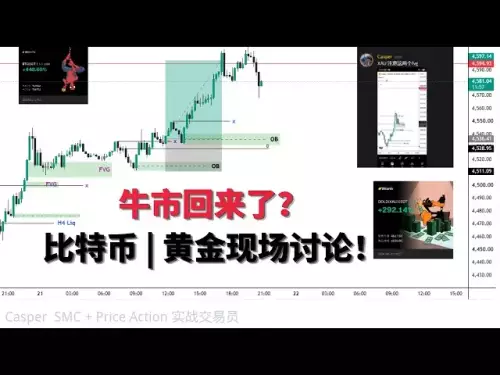
Despite the price looking strong in the short term, there's a hidden bearish divergence that could hint at a continuation of the larger bearish trend.

Bitcoin’s price has shown strength in the past week, but a closer look at the chart reveals a hidden warning signal. According to Crypto World analyst Josh, despite the bullish price action in the short term, there’s a hidden bearish divergence that could hint at a continuation of the larger bearish trend.
The main warning signal on the daily Bitcoin chart is a “hidden bearish divergence.” This occurs when Bitcoin’s price is making lower highs, while the RSI (Relative Strength Index) is reflecting higher highs. Usually, a bearish divergence is a sign that the market could continue its downward trend. However, in this case, the signal is not yet fully confirmed.
Here’s a detailed breakdown of Josh’s analysis:
Bitcoin is currently facing resistance at around $64,500. If it breaks this level in the coming days, the short-term bullish trend could continue. However, if the price fails to push through, we may see a continuation of the bearish trend.
On the downside, support can be found around $63,000 and then further down between $60,200 and $61,200. These are critical levels to watch for any potential breakdown in price.
Another important factor that’s affecting Bitcoin, Ethereum, and Solana is that they are all showing overbought signals in the short term. When a market is overbought, it means there’s limited room for price growth unless there’s a reset. A short-term pullback or sideways movement could help “reset” the RSI and make room for another upward push.
What’s next for Bitcoin?
We’re currently in a short-term bullish trend, but that could change quickly. If Bitcoin can break through the $64,500 resistance, it has room to push towards $79k, which is a significant resistance level based on past market action. On the other hand, failure to break resistance could lead to a return of the bearish trend. In the next few days, the key will be watching for confirmation of either a breakout or a continuation of the bearish trend.
Disclaimer:info@kdj.com
The information provided is not trading advice. kdj.com does not assume any responsibility for any investments made based on the information provided in this article. Cryptocurrencies are highly volatile and it is highly recommended that you invest with caution after thorough research!
If you believe that the content used on this website infringes your copyright, please contact us immediately (info@kdj.com) and we will delete it promptly.